A dynamic electricity tariff is a flexible pricing model where the cost of electricity changes hourly or in 15-minute intervals based on live exchange rates. In Europe the EPEX (European power exchange EPEX SPOT SE) is responsible for the day-ahead-trading. This dynamic tariff allows consumers to save money by shifting high-energy tasks to times when renewable energy is abundant and prices drop. In Germany, energy suppliers are legally required to offer at least one dynamic tariff option to household customers and some of them are advertising with “Save up to 35% compared to fixed price tariffs!”. But is this advertisment valid for a regular customer? Lets see…
Why pondering about dynamic tariffs and where to get a good databasis?
Since July 2026 I’m an owner of an electric car and I was curious if I could reduce my monthly energy-bill using such a dynamic electricity tariff as advertised. But the online-calculators are quite generic and I was not able to find a decent tool that fits all my needs as I wanted a calculation over a full year. As an electrical engineer, it is therefore mandatory to write such a tool myself 🙂 And guess what: compared to the standard tariff, such a dynamic electricity tariff is not cheaper under all circumstances, but one step after another.
I wanted to calculate which tariff is cheaper based on my own energy demand of the year 2025. In my home I got a PV-system with around 10kW peak, a battery with an energy of 14kWh and we are 8 people with 3 fridges, 6 WiFi-Accesspoints and a couple of other electric devices like in other houses. So we have a quite high base-load of around 250 to 300W and several energy-peaks up to 4kW within a regular day. Since a couple of years I’m recording the different loads and energy-sources with an InfluxDB/Grafana-combination, so I got a pretty good idea what happens within my house:

In yellow the power of our PV-system is shown, the power-demand of our house is shown in orange, the battery-power in blue and the resulting grid-power is displayed in green. The SOC of the batteries is shown in purple. For those who are interested: I’m using NodeRED to collect all different systems and write the data to a local InfluxDB every 30 seconds. Grafana is able to display the measurements with either this 30-second-steps or is able to interpolate to different time-steps, which will be important lateron to match my measurements to the 15min-timesteps of the dynamic tariffs. So I got a pretty good databasis for my own home. But where to find the energy prices for a dynamic tariff? In Germany we have two providers who are well known: Awattar and Tibber. But both do not allow to download the energy prices of 2025 as CSV. So I took another approach to get the prices.
The website https://www.energy-charts.info/charts/price_spot_market/chart.htm allows to view and export historic data like energy demand, energy production and the raw EPEX price. So I selected the year 2025 and got this:
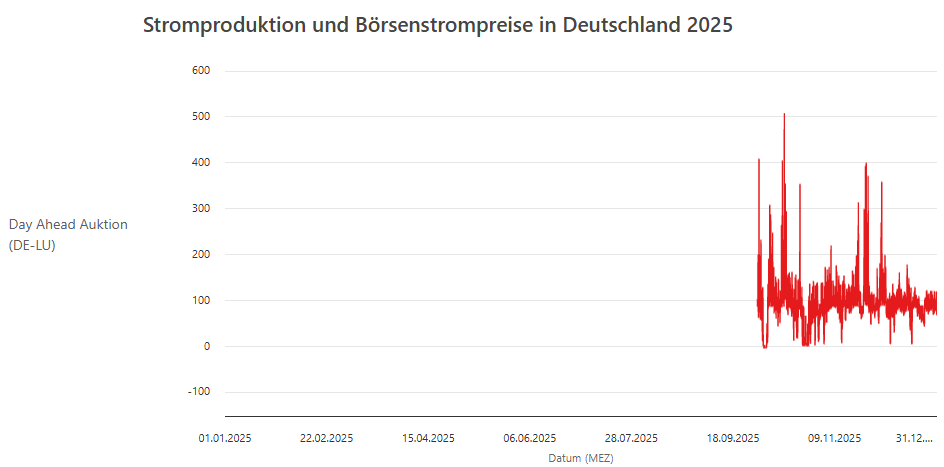
Well – something is missing here as the data only starts in september. A quick search gave the reason: the Day-Ahead Auction switched to 15-minute granularity on September 30, 2025 (for delivery on October 1, 2025) across coupled European markets, replacing exclusive 60-minute blocks while keeping hourly options available. Great, of course the system has to change its rules when I’m trying to use the data… So switching back to an hourly-basis allows access to the first 9 month of the year:
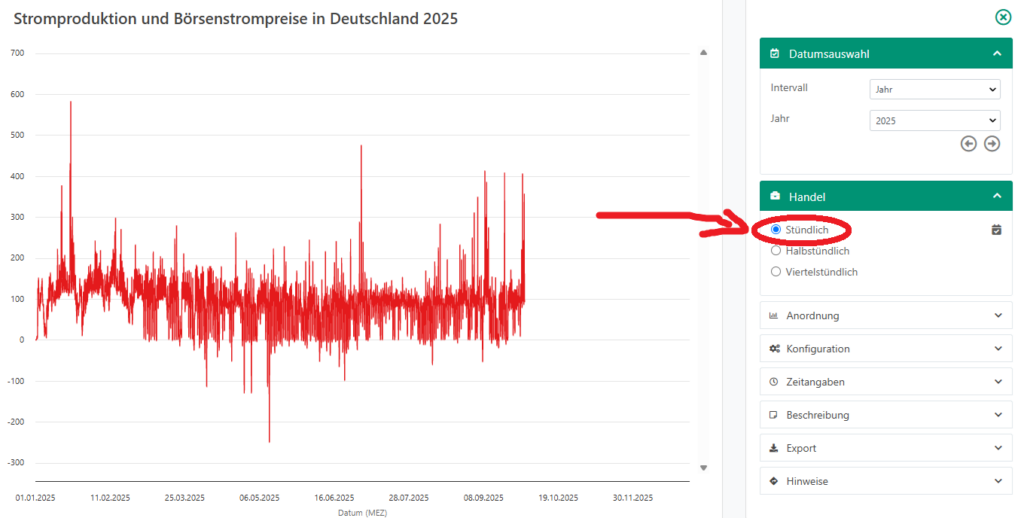
So I got two different sets of data. I imported them as CSV and imported them to MatLAB. Sure, I could use the data of the intraday-trade, but these values are slightly lower compared to the day-ahead-trade. To allow a better granularity, I decided to convert the hourly data to 15min-values using a polynomial interpolation and now the data for 2025 looks like this:
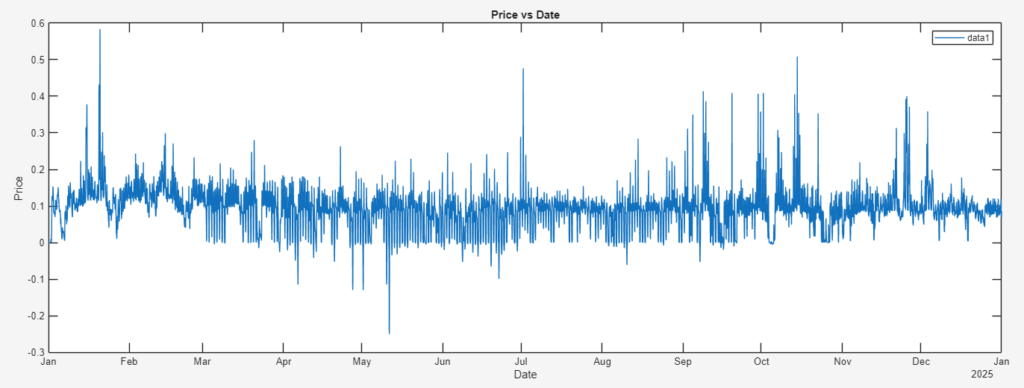
Zoomed-in you can see the interpolated 15min-values even for days in May:
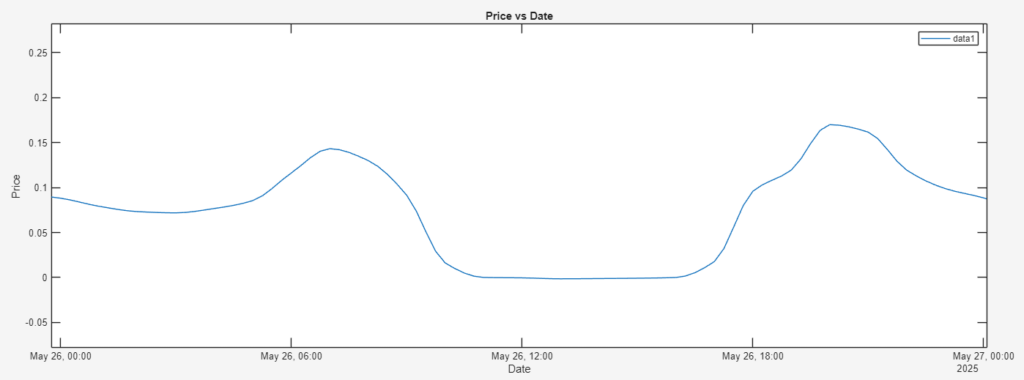
Around noon we have prices around 0ct/kWh – this would be great but this is not the price the enduser has to pay. On top of the EPEX-price we have to take other costs into account:
- Grid fee: 8..11 ct/kWh
- Electricity tax: around 2 ct/kWh
- Concession fee: 1.5 .. 2.4 ct/kWh
- Levies under §19, offshore, and CHP: 1 … 1.5 ct/kWh
- Distribution fee: 1.5 … 3 ct/kWh
- plus 19% VAT
So we have to add 16 ct/kWh and the 19% VAT resulting in this new price in orange:
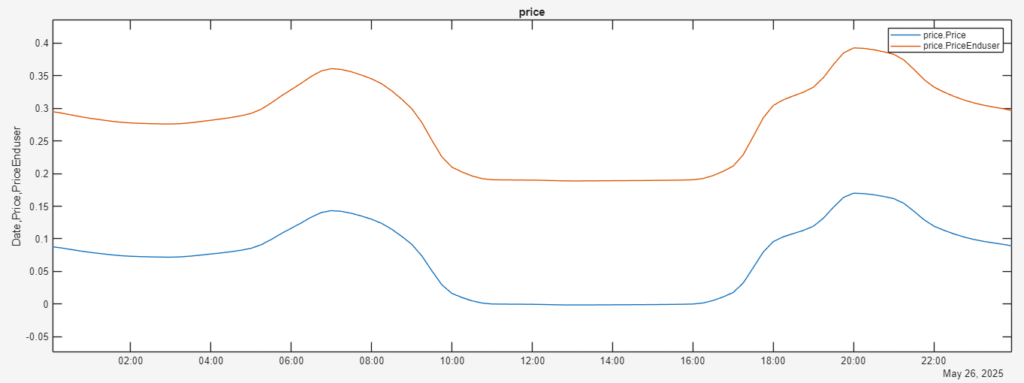
But this still looks better than my regular static price with 30 ct/kWh as I could charge my car and wash the clothes between 10 AM and 5 PM where we have 20 ct/kWh and we could save 10 ct/kWh. But is this price valid? I imported the EPEX-price and added 16 ct/kWh and the 19% VAT on top. Luckily I’ve found some Tibber-prices on the internet. The user “NewBroker” posted a screenshot of the Tibber-price on 11th May 2025 here: https://forum.zendure.com/d/16569
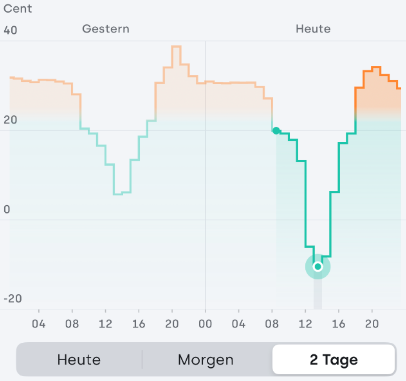
So I converted the picture to a data-set and compared it to my calculated price:

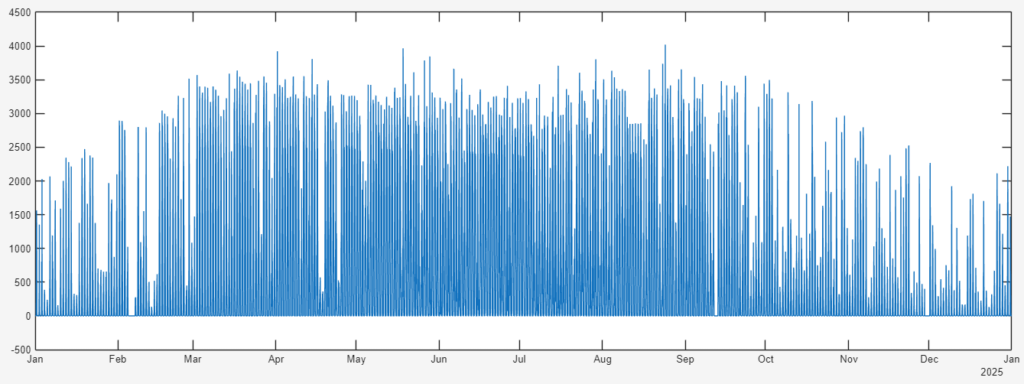
Man, I nailed it 🙂 So now I was pretty confident that my prices for 2025 were valid. So I exported my own data from Grafana and set the time-step to 15 minutes as well. It took a while to synchronize the different timecodes but MatLAB has some nice tools like the function “synchronize” to line-up different timebases with each-other. So I got synchronized data for the PV-power, the power-demand and other values in 15min-steps for 2025.
Here is the generated PV-power for 2025:
The battery-power:
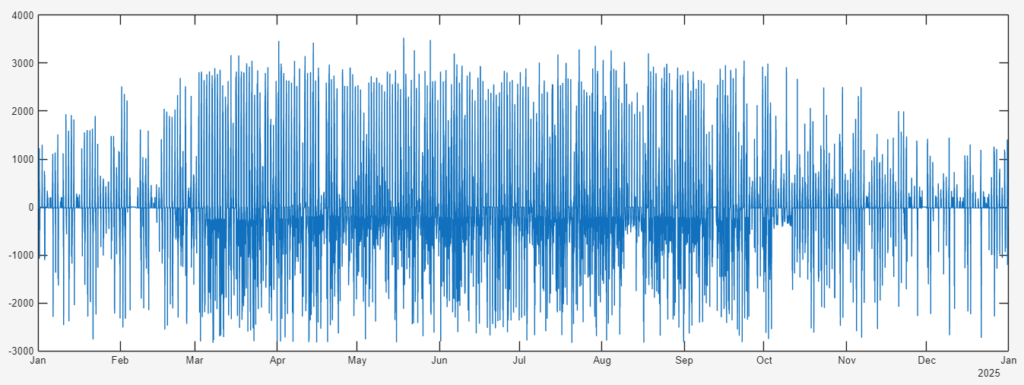
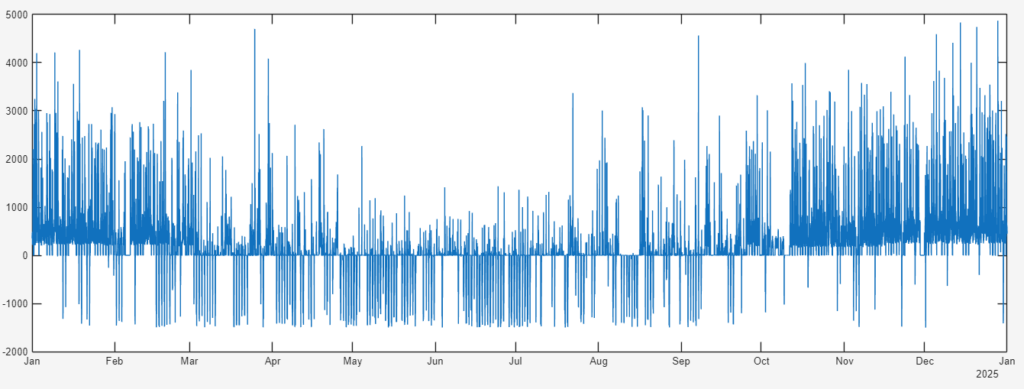
And the grid-power:
When is the best time to charge an EV?
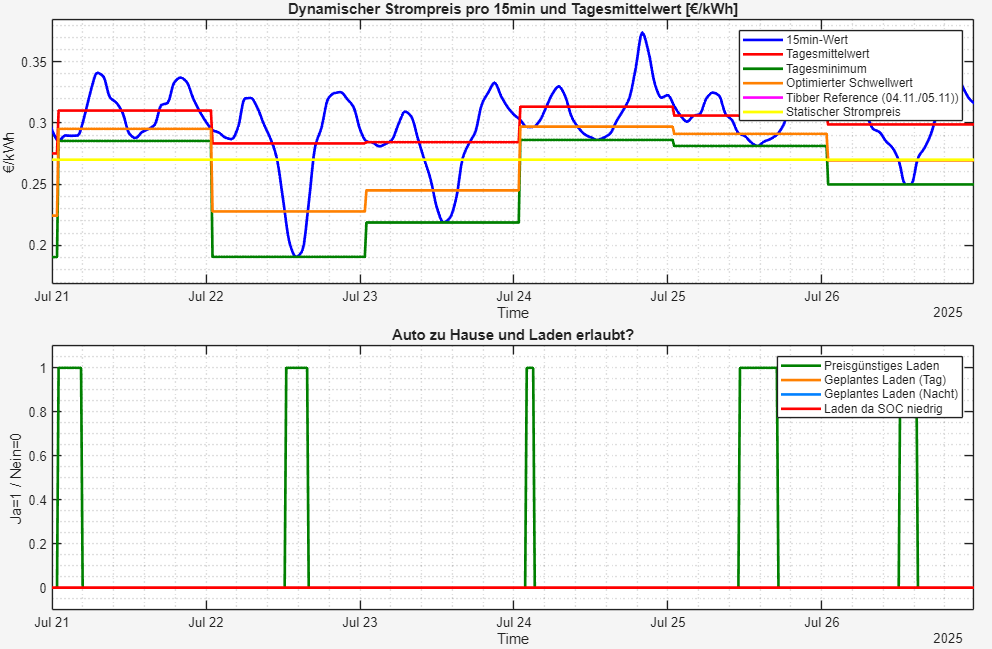
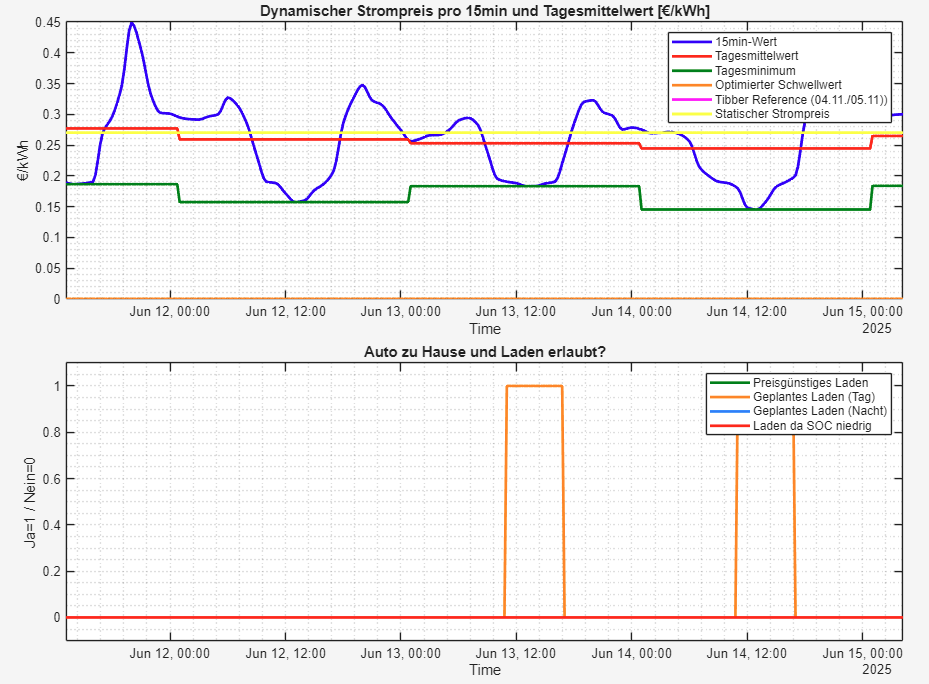
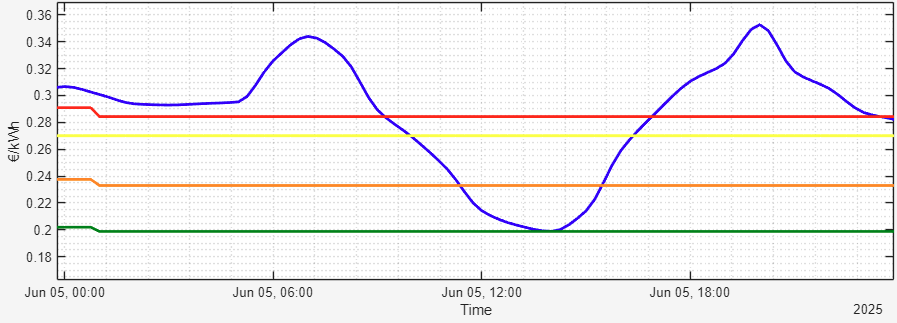
OK, now I’ve got a pretty good idea of the status-quo of my house and the energy-price of 2025. Now I had to add the charging of my EV. We bought an Kia EV6 with an 84kWh battery and a go-e charger Gemini Flex wallbox which charging-power can be set via MQTT between 1.4kW and 11kW. So first I had to think about when is the car at home and when I’m in my office in Kassel which is 44km away from my home. Usually I have two days of home-office on Tuesday and Friday. So the EV can charge on those two workdays as well as Saturday and Sunday. I started a MatLAB-script that supported three different approaches: a simple scheduled charging-plan, a price-optimized charging and a combined charging-schedule. If the SOC of the car is below a minimum value the car should start charging by its own even though the time is outside of the scheduling or the best-price-window. So first I had to calculate some additional price-timelines: the daily mean-value (red curve) and an optimized threshold (orange curve) where the charging may start if the price is below this threshold. Everytime the current price (shown in blue) is below the optimized threshold (in orange) the charging may start if the car is at home:
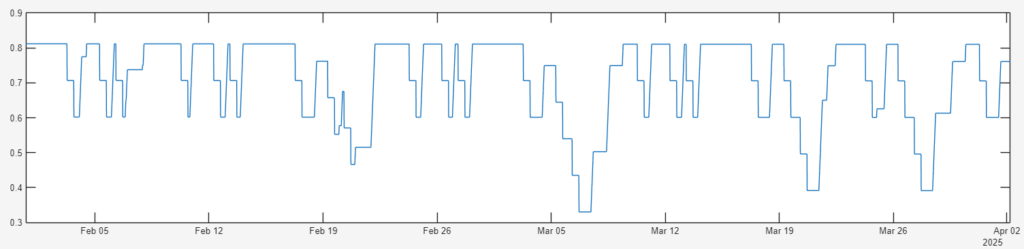
Now I was able to calculate when the car is allowed to charge – either the scheduled charging or an optimized charging. But without a battery-model we do not know if we have to charge, right? But a simple way is to implement an integrator that integrates the power to energy. I set the initial energy to 80% of 84kWh resulting in 67kWh. On days in Kassel I’m driving 44km at 7 AM with an energy-demand of around 20kWh/100km and back home in the afternoon at 5 PM. So I got a working model of the battery and the allowed charging resulting in an SOC like this:
Compared to the optimized charging the scheduled charging between 11 AM and 7 PM looks like this:
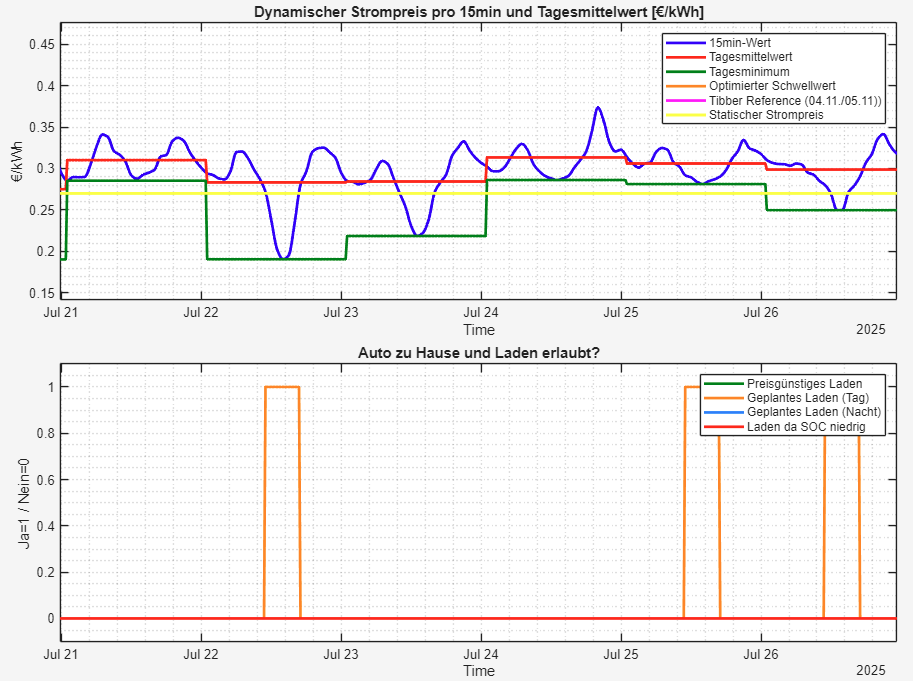
As you can see, the scheduled charging meets the low-price-segments of the dynamic energy-tariff pretty well. So it seems that the scheduled charging could result in comparable costs to the optimized charging based on the price. But to get a full picture, lets include the other energy-loads of the house to calculate a full year.
Energy-cost of a full year with PV, regular energy-demand and the EV-charging
Looking at the full year 2025 we can see nothing more than a colorful mess:
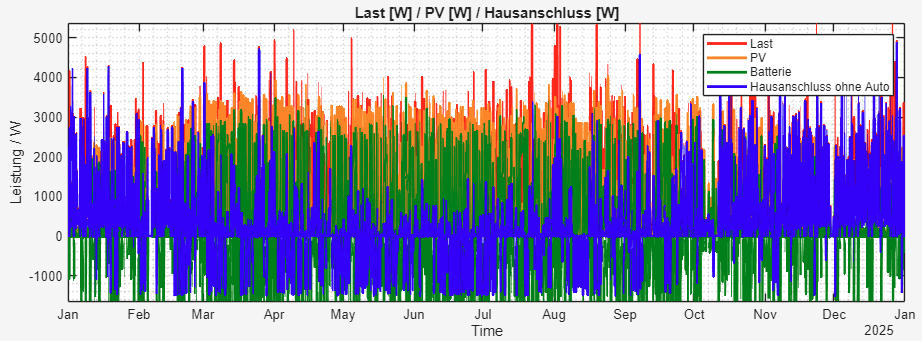
So lets zoom into the June for instance. Here you can see the PV-power in orange, the regular load in red and the battery-power in green. The blue-curve shows the grid-power of my home without the EV:

In Germany you get around 8 ct/kWh if you are feeding-in energy to the public grid – while paying between 27 and 30 ct/kWh for energy-demand. So during summer I’m “loosing” some money when feeding-in energy to the grid. Looking at the calculated prices for this time-periode and when a charging is possible, we got two days homeoffice where the EV could be charged:
This results in a much better usage of my PV-power. The following graph shows the charging-power of the EV in orange (set to a fixed power of 4kW via the wallbox), the energy-demand from the grid in red and the fed-in energy in green:
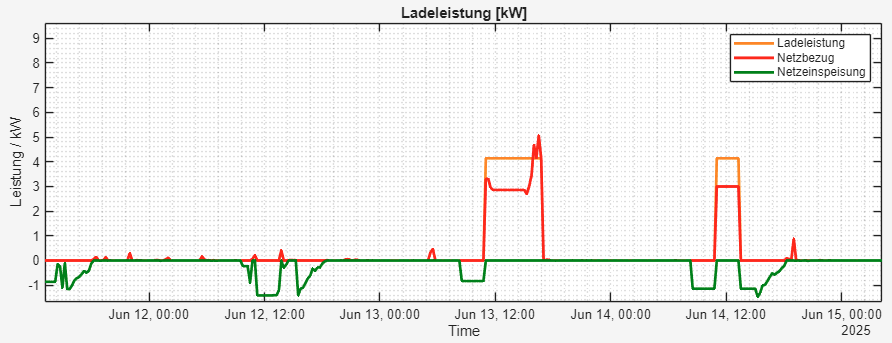
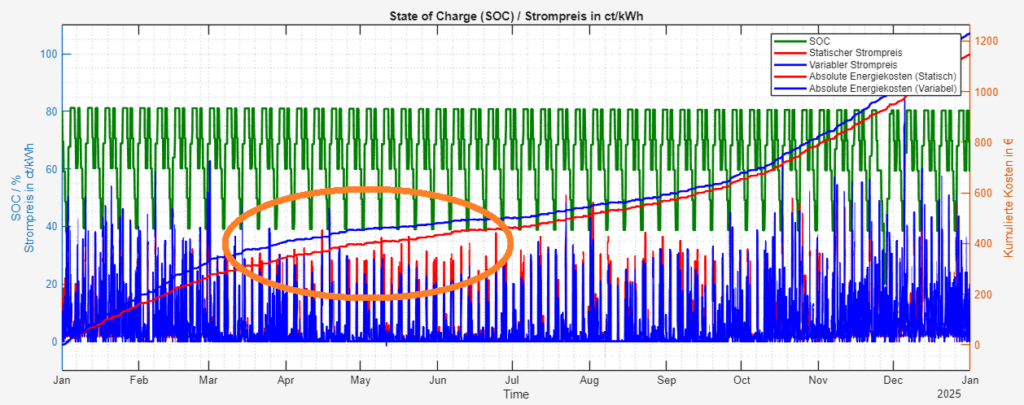
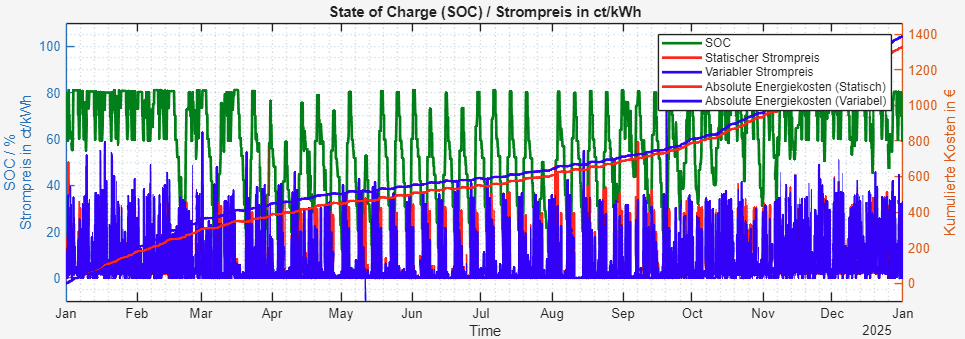
So I can use my PV-power much better without losing money when looking at the 8 ct/kWh compared to the 27…30 ct/kWh. But what about specific energy-costs for the full year? My MatLAB-script integrates the charging power to calculate the total price when using a static tariff. In 2025 this was 30 ct/kWh. Without taking holiday into account my script calculates 88km per workday in Kassel resulting in 13.728km per year. With 20kWh/100km this results in 2.745 kWh, so 824 €. This math is quite simple as we have static values. To take the dynamic energy-tariff into account my script checks if the car is at home, the SOC below the maximum value and either the charging is scheduled or the energy-price below the calculated threshold. This results in the following diagram (click on the picture to see it in a better resolution):

In green you can see the SOC and in blue/red the current energy-price depending on the charging-power – blue for dynamic tariff and red for static tariff. These prices are integrated into the continuous curves in red and blue showing the absolute price over the year. The problem – as always – is the wintertime where PV-power is low and the energy costs are high. I highlighted the worst time in year with the orange circle: here the static price of the regular tariff has a much better value compared to the variable tariff which hurts so hard that the summer-time cannot compensate this issue:
In plain numbers this results in the following values for the whole year 2025:
- I would earn only 36 € with the feed-in-tariff (8 ct/kWh)
- costs with a fixed tariff with 27 ct/kWh would result in 1.147 €
- costs with a dynamic tariff results in 1.230 €
So a dynamic tariff with a simple scheduled charging would cost me 83 € more compared to the static tariff. Lets switch to the cost-optimized charging method:
- earning through feed-in-tariff: 38 €
- costs with fixed-tariff: 1.148 €
- costs with dynamic tariff: 1.198 €
So still I have to pay 50 € more compared to the static tariff. The main-problem: in 2025 the price during the night-time did not go down below 25 .. 30 ct/kWh so charging during night was not an option while the car was not at home during three days in the week.
Using EV during home-office?
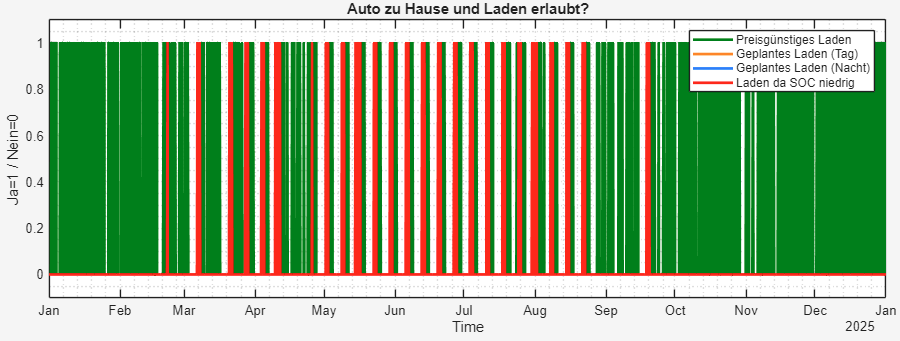
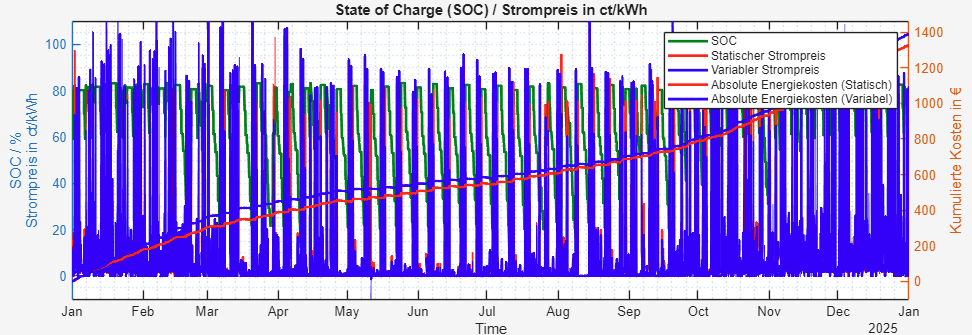
As my wife still has a Diesel she wants to use the EV when I’m in home-office. So lets change the calculation so that my wife is using the EV during home-office between 7 AM and 1 PM as she is a teacher and would be back right after lunch. With 4kW of charging-power this would result in multiple forced recharging during the year (red lines):
So the SOC-curve gets more volatile now:
Lets compare the costs:
- earned money through feed-in: 42 €
- costs with fixed tariff: 1.328 €
- costs with dynamic tariff: 1.388 €
Still a dynamic tariff is 60 € more expensive. Even increasing the charging-power from 4kW to 11kW won’t change much:
- earned money through feed-in: 46 €
- costs with fixed tariff: 1.329 €
- costs with dynamic tariff: 1.392 €
Using vacation to mitigate high prices?
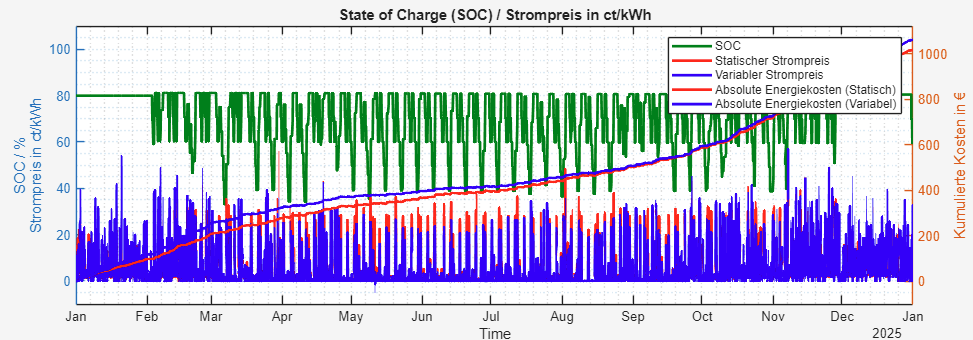
As December and January are the most expensive months I could take my vacation to optimize my cost, but even then the base-load of the house would be the problem. In the following diagram I took vacation from 1st of December to End of January which would be 10 days more than a regulary contract would allow as we have around 30 days of vacation in Germany:
- earned money through feed-in: 38 €
- costs with fixed tariff: 1.020 €
- costs with dynamic tariff: 1.064 €
So still the dynamic tariff is 44 € more expensive compared to the static tariff. Still the first three months of the year are the main-problem.
Summary and outlook
Well, in the beginning I was quite confident that a dynamic tariff could help me saving some money with my EV, but when taking the base-load of the house and the presence of the car during the week into account, the reality shows a different picture. Anyway, my old Diesel had a consumption of 5 liter per 100km resulting in 686 liter Diesel per year with around 2.3 €/liter in 2026 resulting in expenses of around 1.580 € per year. With my new EV I have to spend 27 ct/kWh resulting in 741€ per year – only 47% compared to the Diesel.
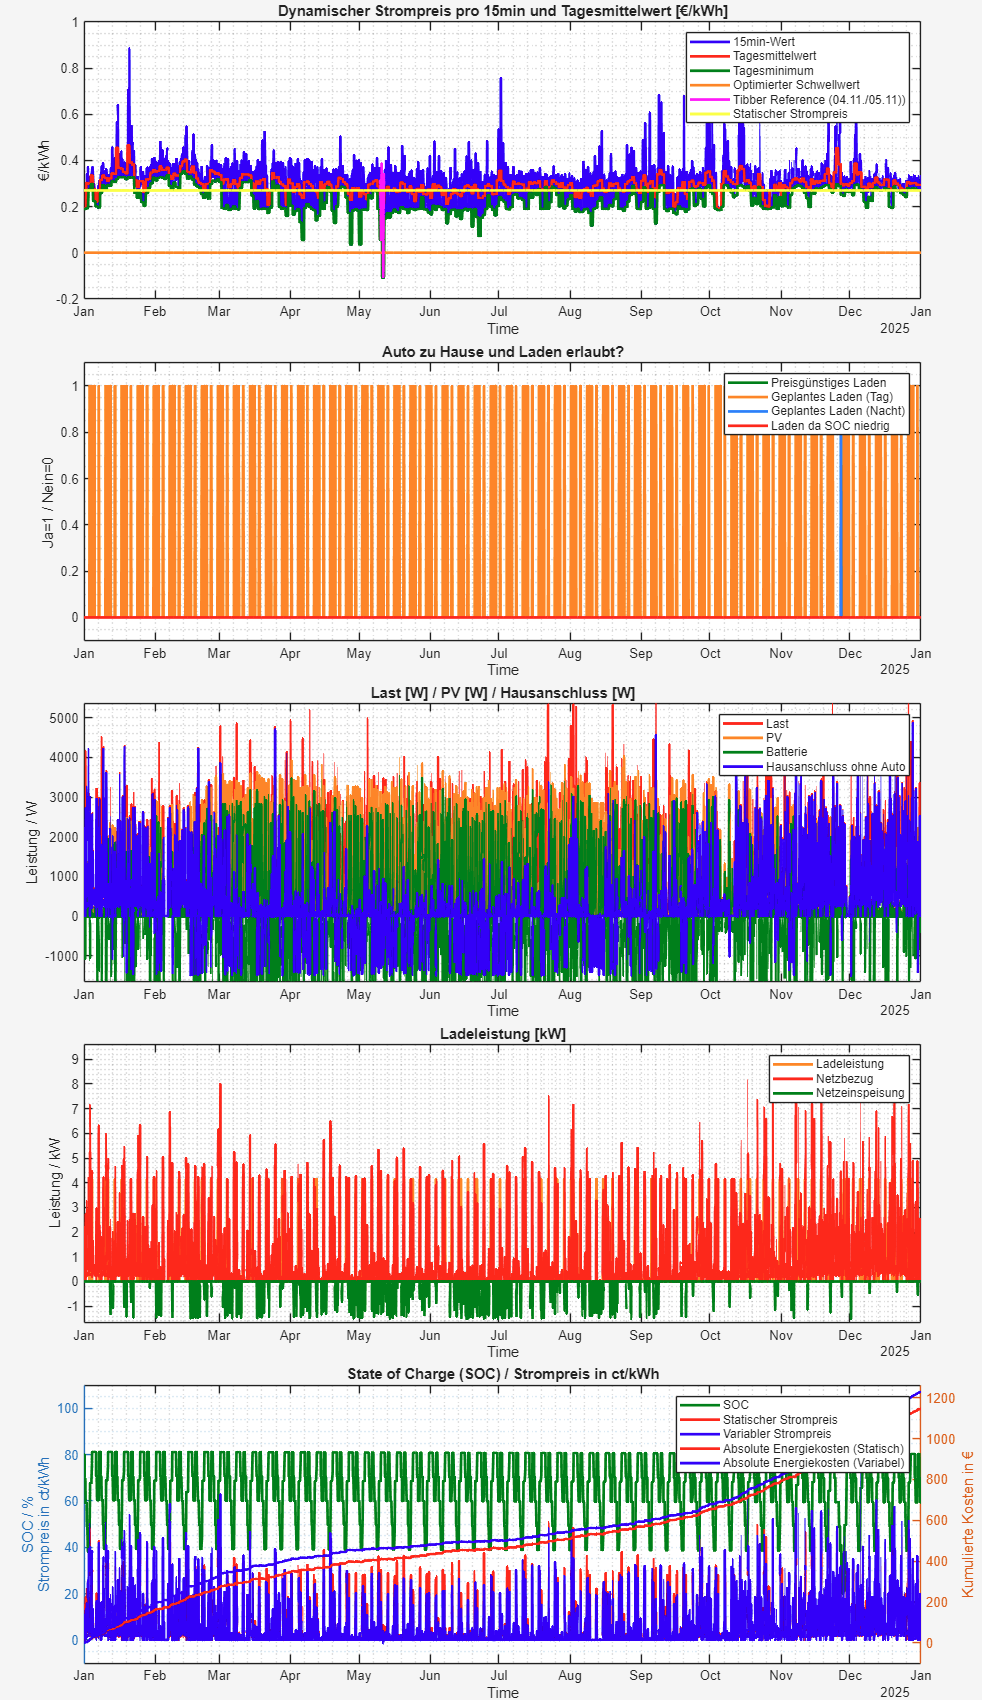
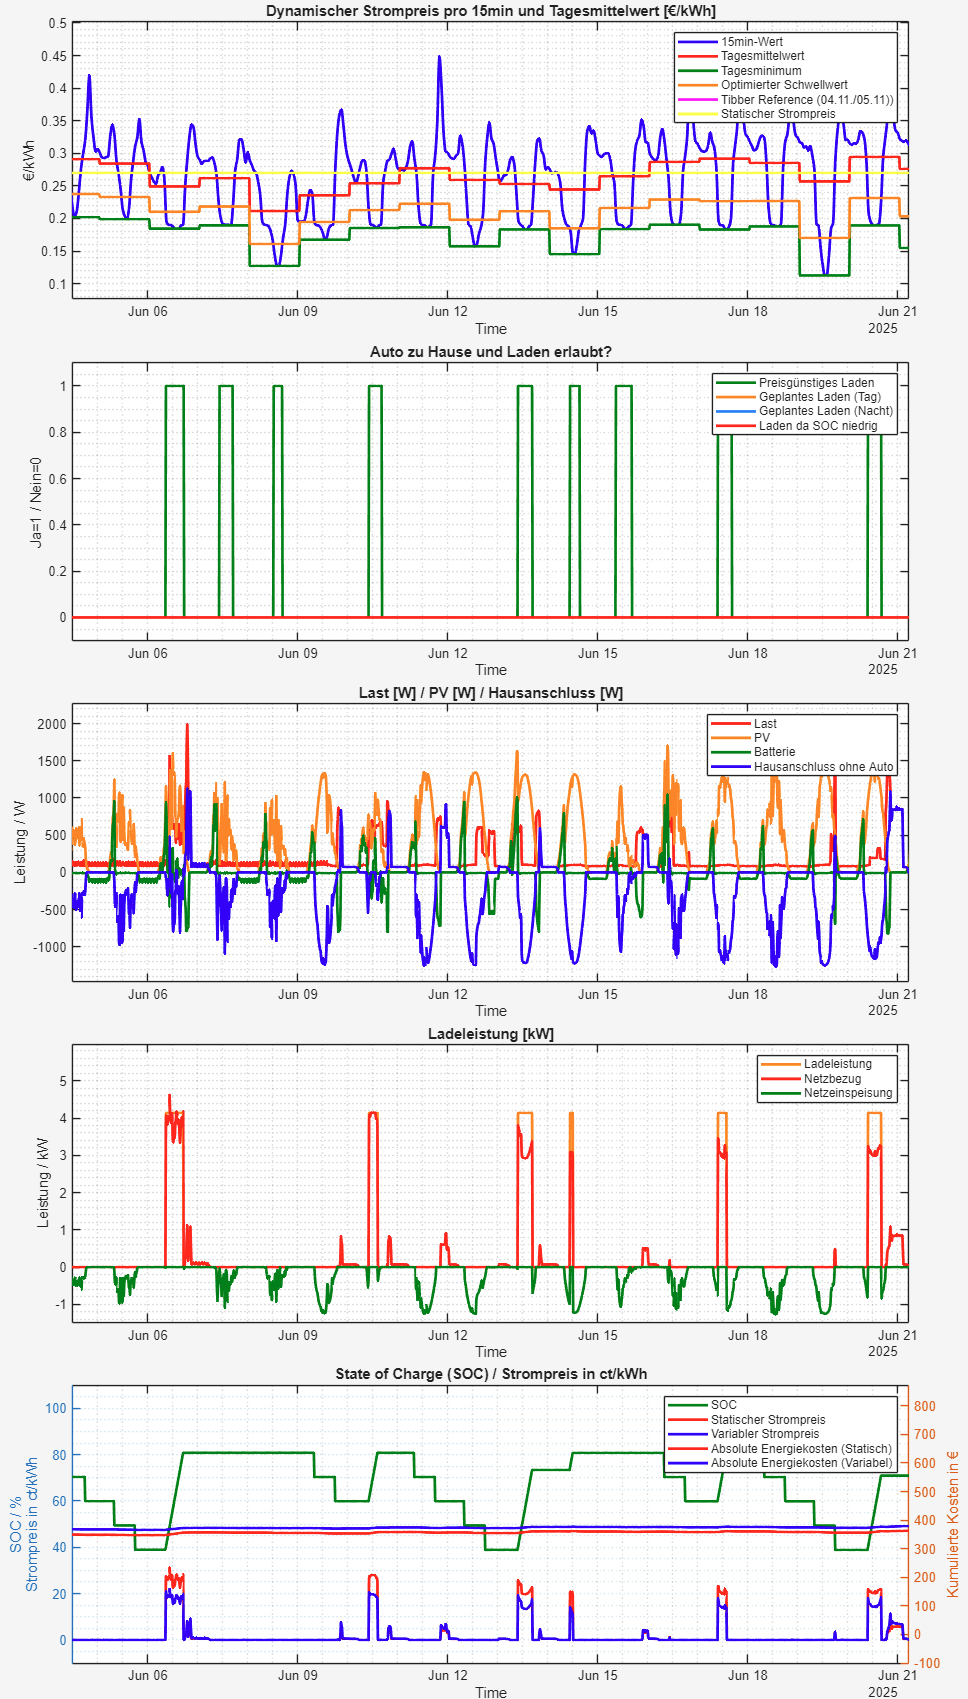
If you are interested, this is my final calculation for 2025:
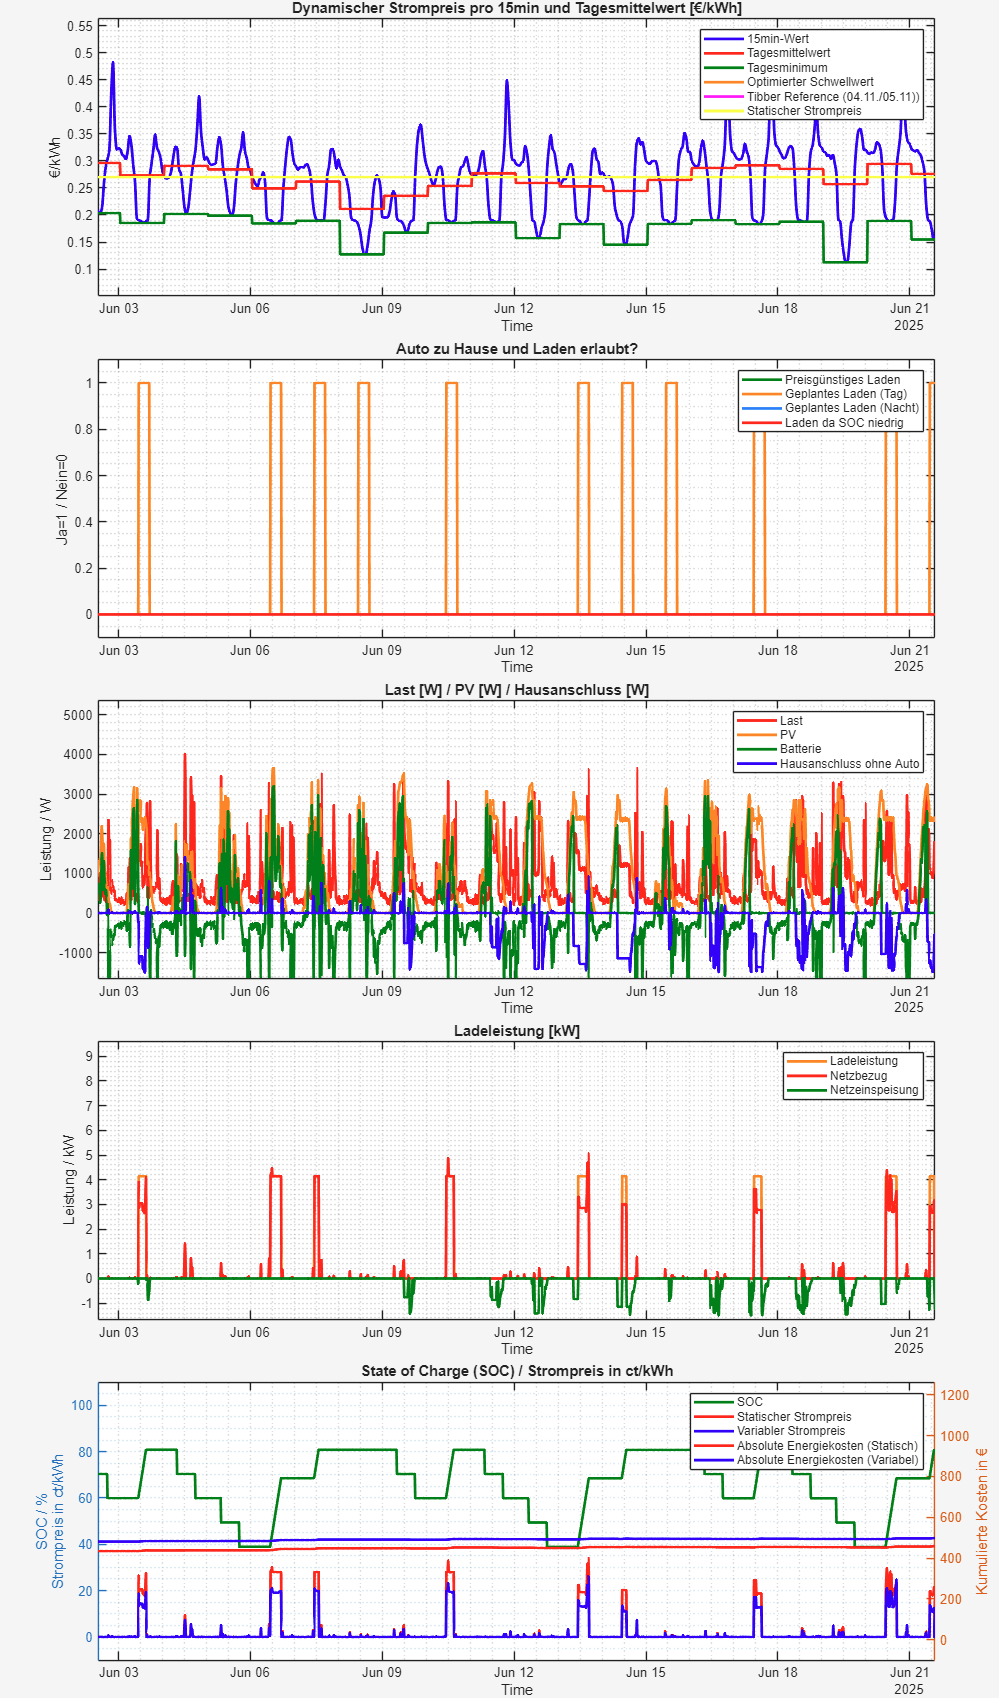
And here a zoom into some days in June 2025:
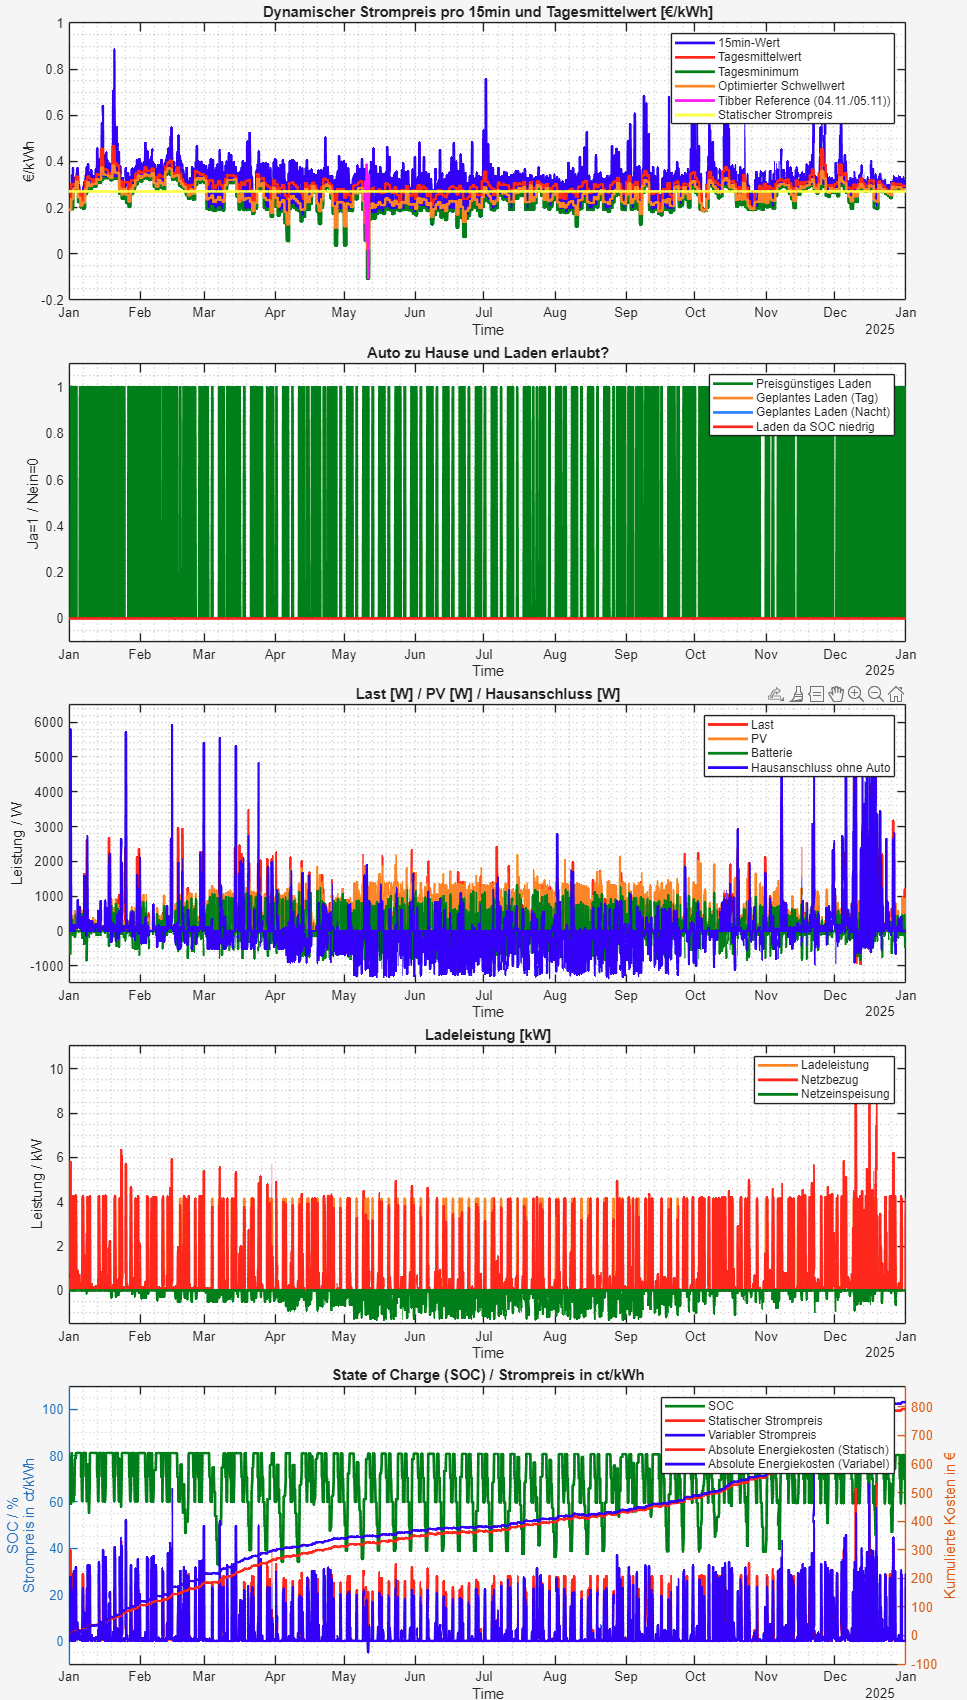
Up to now I showed only data of my house but we are lucky to have a second property for our vehicles with a dedicated PV system. Here the base-load is only around 80 W for two access-points and some secondary devices like a RaspberryPi. In this building the peak-PV-power is 1.6 kW and limited to 800 W to the grid. When using the cost-optimized method these are the resulting values:
- earned money through feed-in: 60 €
- costs with fixed tariff: 792 €
- costs with dynamic tariff: 817 €
So the dynamic tariff is still 25 € more expensive compared to the static one – what a pity. For the sake of completeness, here are the calculated curve profiles:
And again – zoomed-in to a day in June:
If the prices during night-time won’t drop below the 20 ct/kWh barrier, I’m pretty confident that staying in the regular tariff will be the best choice. At the very least, I couldn’t see the potential savings of up to 35% when using real-world-data.